 Mark
Mark
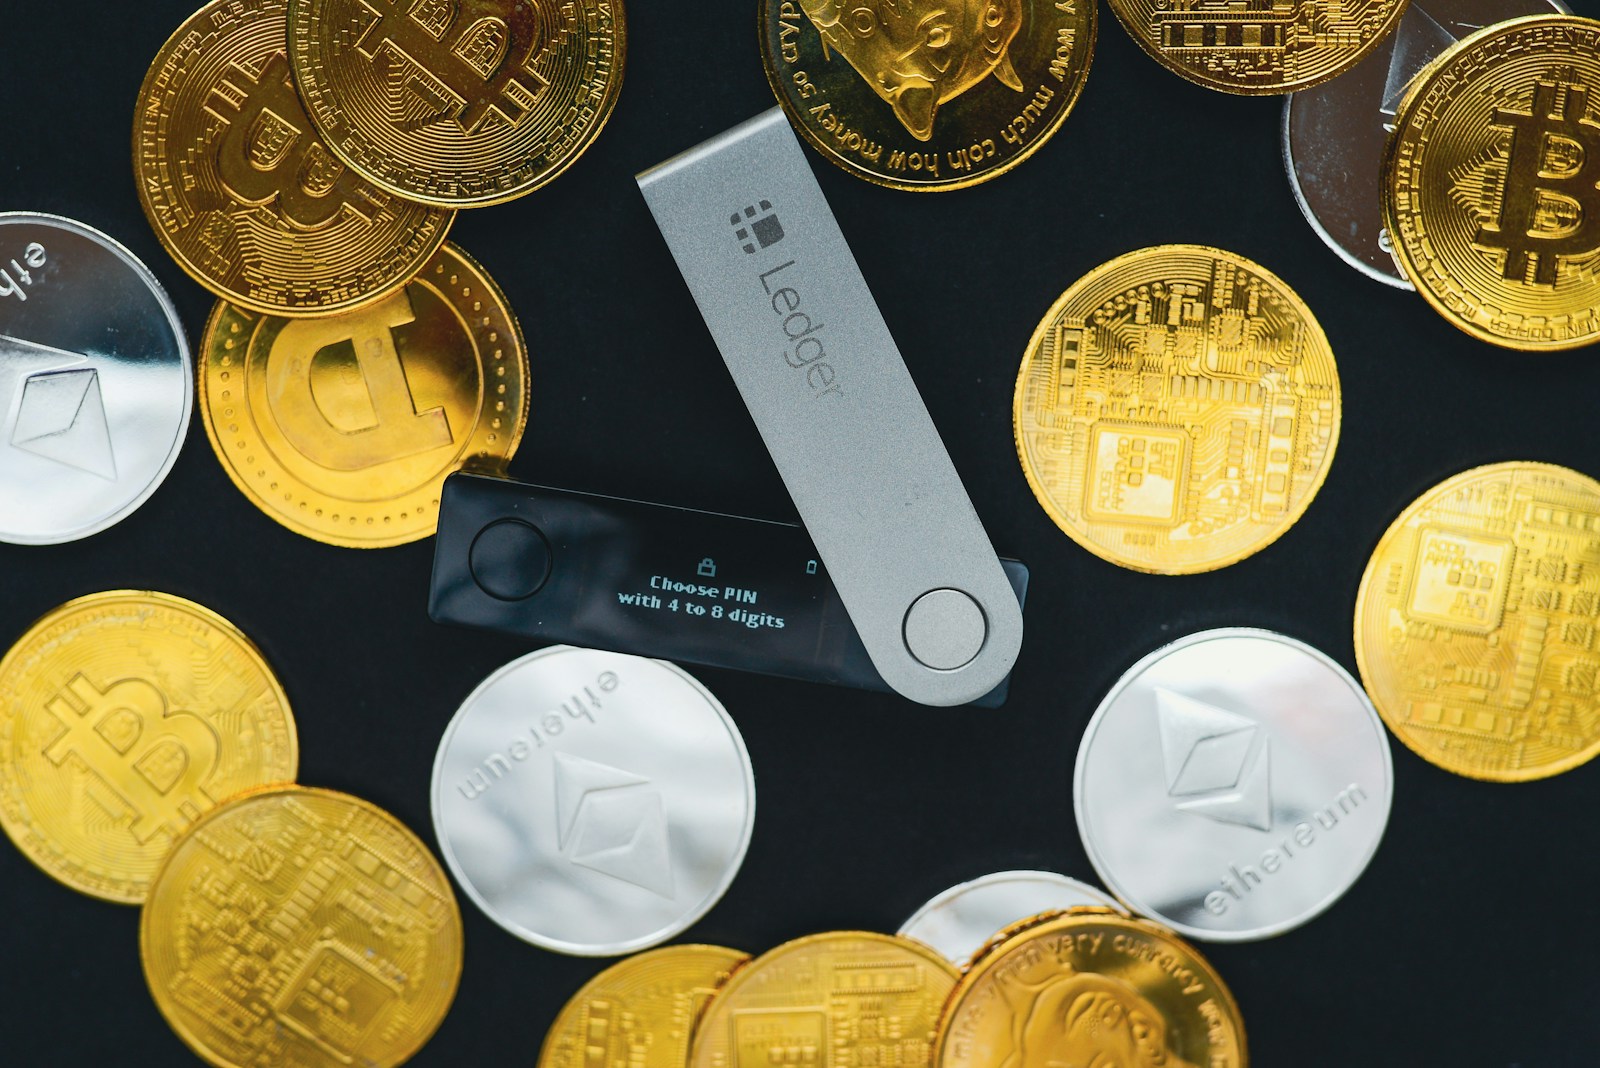
Crypto portfolio analysis becomes difficult long before the number of assets grows large. An investor may hold coins across several exchanges, keep long-term positions in private wallets, participate in staking, and maintain stablecoins for liquidity. Each platform presents data differently, while token prices and portfolio weights can change around the clock. The challenge is not merely checking the current balance. It is building a consistent picture of exposure, performance, concentration, and risk.
AI-assisted financial tools can reduce the time spent organizing this information and interpreting recurring patterns. Through a platform such as www.finmetryai.com, users can analyze financial data, automate parts of reporting, explore trends, and work with uploaded files through a conversational interface. The technology is most useful when it supports a clearly defined analytical process rather than producing an isolated buy-or-sell answer.
Why a wallet balance is not a complete portfolio view
A balance shows how much of each asset is currently held, but it does not explain how the portfolio reached that state. Two investors may own the same amount of Bitcoin and Ether while having completely different risk profiles. One may have accumulated gradually over several years, while the other entered after a sharp market rise. Purchase prices, holding periods, transaction costs, asset concentration, and the purpose of each position all affect the interpretation.
Data fragmentation adds another layer of complexity. Centralized exchanges may provide transaction histories as CSV files, wallets reveal on-chain movements, and staking platforms report rewards separately. Transfers between accounts controlled by the same investor can look like withdrawals and deposits rather than internal movements. Unless records are classified consistently, calculations may count the same capital more than once or treat a transfer as income.
A useful analytical system therefore begins with a portfolio ledger rather than a screenshot of current holdings. The ledger should identify purchases, sales, transfers, fees, rewards, deposits, withdrawals, and conversions. Once these events are organized, AI can help summarize activity and highlight inconsistencies, but it cannot infer the meaning of every transaction without appropriate labels.
Preparing crypto data for AI-assisted analysis
Input quality determines whether the resulting report reflects the portfolio accurately. Before uploading files or asking analytical questions, investors should normalize the information collected from exchanges, wallets, and other services. This does not require a complex institutional database. A structured spreadsheet with clear columns is often sufficient for an initial review.
- Use one date and time format across all records.
- Identify the asset and quantity involved in each transaction.
- Separate purchases, sales, transfers, rewards, and fees.
- Record the currency used to measure value at the time of the event.
- Label wallets and exchange accounts controlled by the same owner.
- Remove duplicates created by combining exports from multiple sources.
- Mark incomplete records that require manual confirmation.
Internal transfers deserve particular attention. When tokens move from an exchange to a hardware wallet, the portfolio has not generated a loss or made a new investment. Only the location of the asset has changed, although a network fee may have been paid. If the receiving address is not recognized as an internal destination, an automated system could classify the transaction incorrectly.
Token swaps also require careful treatment. Exchanging one crypto asset for another involves both the disposal of the original position and the acquisition of a new one. A raw transaction export may show several entries for the swap, including platform and network fees. The records should be grouped logically before performance or cash-flow conclusions are drawn.
Start with questions, not predictions
Broad prompts such as “analyze my crypto portfolio” leave too many decisions to the system. The AI must choose a time frame, decide which metrics matter, and guess what the investor wants to achieve. A more effective approach is to begin with a specific practical question.
Examples include identifying which assets contributed most to a monthly loss, measuring how portfolio concentration changed during a market rally, or comparing the current allocation with a predefined target. Investors can also ask for unusually large transactions, changes in stablecoin reserves, or positions whose weight increased primarily because of price movement rather than additional purchases.
A well-constructed request normally defines four elements: the dataset, the time period, the metric, and the desired output. For example, an investor could request a table comparing beginning and ending portfolio weights over one quarter, followed by a short explanation of the largest changes. This makes the result easier to verify than a general narrative about market conditions.
Measuring concentration and allocation drift
Concentration is one of the most important portfolio characteristics because it determines how strongly a single asset can influence the total result. A portfolio containing ten tokens is not necessarily diversified. If one token represents most of the value, the remaining positions may have little effect on overall risk.
AI can calculate current weights and compare them with previous periods or target allocations. This is particularly useful in crypto markets because price changes can alter portfolio structure quickly. A position that originally represented a modest allocation may become dominant after a strong rally, even when the investor has not purchased more of it.
Allocation drift is not automatically a reason to sell. It is a signal that the portfolio no longer matches its earlier structure. The investor must decide whether the change reflects a deliberate conviction, an acceptable deviation, or an unintended increase in exposure. AI can identify the drift and model rebalancing options, but the decision depends on strategy, costs, liquidity needs, and personal risk tolerance.
Performance attribution beyond the total return
A single percentage return says little about how the outcome was produced. Portfolio performance can result from asset selection, timing, position size, staking rewards, trading activity, and fees. AI-assisted attribution helps separate these components and reveal whether the strategy worked as intended.
Suppose a portfolio gained value during a quarter. The increase may have come almost entirely from one large Bitcoin position, while several smaller speculative assets declined. Without attribution, the positive total could hide weak selection elsewhere. Conversely, a portfolio loss may be concentrated in one position rather than reflecting a failure across the entire strategy.
Transaction costs should be included whenever the available records support them. Frequent swapping, withdrawals, and transfers can create a meaningful drag on results, especially for smaller positions. An analysis that ignores exchange commissions and network fees may overstate the benefit of active management.
Staking rewards and other distributions should also be shown separately from market appreciation. Receiving additional tokens is different from an increase in token price. Separating these sources makes it easier to understand whether returns came from the asset’s market movement, income-like rewards, or additional capital contributions.
Using scenarios instead of relying on one forecast
Crypto markets contain too much uncertainty for a single precise forecast to provide a dependable decision rule. Scenario analysis offers a more practical alternative. Rather than asking what a token will be worth on a specific date, investors can examine how the whole portfolio might behave under several defined conditions.
A downside scenario may apply different declines to large-cap assets, smaller tokens, and stablecoin-related positions. A liquidity scenario can assume that certain assets cannot be sold at the displayed market price without slippage. Another scenario may test the effect of a major position becoming temporarily inaccessible because an exchange or network service is unavailable.
The purpose is not to predict the exact event that will occur. It is to reveal where the portfolio is fragile. If a moderate decline in one asset creates an unacceptable total loss, the investor has learned something useful even if that particular scenario never happens. AI can recalculate many variations quickly and summarize which assumptions have the greatest effect.
Stress-testing liquidity and access
Market value and usable liquidity are not the same. An asset may have a quoted price but limited trading depth, long unstaking periods, withdrawal restrictions, or dependence on a particular bridge. Portfolio analysis should therefore consider how quickly positions can be converted or moved under adverse conditions.
A practical liquidity review can group assets by access conditions. Immediately available exchange balances belong in one category, assets in self-custody in another, and locked or staked positions in a third. The investor can then compare short-term obligations with funds that are realistically available rather than with the total displayed portfolio value.
AI can help identify concentration by platform as well as by asset. Holding several different tokens on one exchange may appear diversified from a market perspective, yet all positions remain exposed to the same operational dependency. Similarly, using one bridge or staking provider for multiple assets creates a shared source of risk that token-level analysis may miss.
Detecting anomalies without treating them as signals
Automated systems are useful for finding transactions or changes that differ from normal activity. Examples include a fee far above the usual range, an unexpected withdrawal, a sudden increase in trading frequency, or a portfolio weight that moved sharply within a short period. These anomalies deserve investigation, but they are not automatically evidence of fraud, opportunity, or strategy failure.
An unusual fee may result from network congestion. A large withdrawal may be an internal transfer to cold storage. Rapid trading may reflect a planned rebalancing event. The system can direct attention to the record, while the user supplies the context needed to classify it correctly.
For security-sensitive reviews, investors should avoid uploading unnecessary private information. Seed phrases, private keys, recovery codes, exchange passwords, and wallet-signing credentials are never required for portfolio analysis. Public addresses may be useful in some workflows, but even they can reveal sensitive financial relationships and should be shared only after considering the privacy implications.
Matching an AI plan to the analytical workload
The appropriate service level depends on how often analysis is performed, how much data is processed, and how complex the follow-up conversation becomes. FinMetry.ai offers subscription options with different token allowances, processing priorities, and CSV or XLSX file-size limits, as well as a token-based model. Reviewing the FinMetry.ai pricing options is therefore most useful after estimating a realistic monthly workflow.
An individual who reviews one consolidated spreadsheet periodically may need far less capacity than an analyst processing several exchange exports every week. Larger files can matter when transaction histories span multiple accounts or contain high-frequency activity. Processing priority may become relevant for teams that use the system during recurring reporting cycles rather than for occasional research.
Token allowances should not be evaluated only by the length of the initial prompt. A complete analysis often involves several stages: checking the imported data, requesting calculations, correcting classifications, testing scenarios, and generating a final report. Estimating the full conversation provides a better basis for comparing plans than counting only the first request.
How to verify an AI-generated portfolio report
Every important result should be checked against the original records. The review can begin with simple controls: total asset quantities, reporting dates, currencies, and account coverage. If the system calculates portfolio weights, they should add up correctly. If it reports a percentage change, the underlying beginning and ending values should be visible.
The next step is to distinguish calculations from explanations. A table showing that an asset’s weight increased is a numerical result. A statement claiming that investor sentiment caused the increase is an interpretation and may require external evidence. AI-generated reports become safer when facts, assumptions, and hypotheses are presented separately.
Useful verification questions include:
- Which transactions had the greatest effect on this result?
- Were internal transfers excluded from income and expenses?
- How were fees and staking rewards classified?
- Which exchange rate or valuation time was used?
- What records appear incomplete or inconsistent?
- How would the result change under another classification rule?
Investors should manually repeat a sample of key calculations. Checking one asset’s cost basis, one portfolio-weight change, and one period return can reveal whether the broader methodology is reliable. When a result influences a significant financial decision, independent professional review may also be appropriate.
A repeatable monthly portfolio review
- Collect the records. Export transactions from exchanges and other platforms, then add relevant wallet activity.
- Normalize the data. Align dates, currencies, categories, and account labels.
- Reconcile balances. Confirm that transaction records produce the quantities actually held.
- Measure allocation. Calculate asset, platform, and liquidity concentration.
- Attribute performance. Separate price movement, trading results, rewards, fees, and capital flows.
- Run scenarios. Test market declines, liquidity constraints, and changes in dominant positions.
- Review exceptions. Investigate unusual transactions and unexplained differences.
- Record decisions. Document any rebalancing action and the reasoning behind it.
Following the same sequence each month creates a more useful historical record than conducting irregular reviews only after major price movements. Consistency also makes AI assistance more effective because the data structure, analytical questions, and output format remain stable across periods.
Keeping human judgment at the center
AI can process records, compare periods, identify outliers, and model scenarios, but it does not know why an investor holds a position. It cannot determine whether a volatile allocation is appropriate for someone’s income stability, time horizon, tax situation, or tolerance for loss. Those factors exist outside the transaction file.
The strongest workflow assigns the system a supporting role. It handles repetitive calculations and highlights issues that deserve attention. The investor defines the strategy, verifies the data, evaluates uncertainty, and decides whether action is necessary. This division preserves the speed of automation without treating a generated answer as financial authority.
For crypto investors, better analysis does not mean producing more predictions. It means knowing what is owned, where it is held, how the result was generated, and what could cause the portfolio to behave differently from expectations. AI can make that review faster and more structured, provided the inputs are accurate and every major conclusion remains open to verification.