Accurate prediction relies heavily on analyzing collective psychology reflected in online chatter. Tracking sentiment shifts across platforms like Twitter and Reddit reveals short-term momentum changes before price moves materialize. For example, a 15% surge in positive social signals often precedes a 5-8% price uptick within 24-48 hours, underscoring the value of incorporating mood metrics into trading models.
Sentiment analysis tools quantify emotions such as fear, greed, and optimism by parsing millions of messages daily. These signals act as leading indicators, offering insight beyond traditional technical analysis. However, discerning genuine shifts from noise requires weighting sources by influence and engagement levels–high-volume accounts can distort overall readings if treated equally with casual users.
Recent case studies highlight how spikes in social activity correlate with volatility bursts. During Q1 2024, sudden surges in bullish sentiment around Layer 2 tokens aligned with over 20% price gains amid low liquidity conditions. This psychological feedback loop amplifies trends but also increases risk; recognizing these patterns helps manage exposure effectively.
Integrating social data with quantitative models enhances forecasting accuracy by capturing the human factor driving markets. Are traders ready to leverage these nuanced behavioral indicators systematically? As algorithmic approaches evolve, combining raw price data with refined sentiment scores becomes indispensable for robust decision-making.
Interpreting Market Mood Through Behavioral and Social Indicators
The most reliable method to gauge the collective psychology behind asset price movements lies in analyzing behavioral indicators derived from social platforms, forums, and transactional data. Metrics such as tweet volumes, sentiment scores extracted from natural language processing models, and on-chain activity provide quantifiable signals that reflect investor confidence or fear. For instance, during the 2021 bull run, spikes in positive sentiment across Twitter correlated strongly with price surges above key resistance levels like $60,000 for Bitcoin. Tracking these variables allows for short- to medium-term prediction of market shifts by capturing the prevailing mood before it fully manifests in price action.
Sentiment analysis tools aggregate thousands of messages, identifying prevailing emotional tones–optimism, uncertainty, or panic–that often precede volatility. Yet these indicators must be cross-referenced with technical charts and volume data to avoid false positives caused by coordinated hype or misinformation campaigns. A 2023 case study involving Ethereum revealed how sudden negative chatter on Reddit coincided with a 15% intra-day drop but was swiftly corrected when fundamentals remained strong. This demonstrates how layered analysis combining social dynamics with on-chain metrics improves forecasting accuracy.
Technical Signals Versus Social Dynamics: Balancing Quantitative Data
Price oscillations frequently originate from shifts in trader psychology triggered by external stimuli such as regulatory announcements or macroeconomic news. Social signals act as early warnings by capturing immediate reactions before institutional investors adjust positions. Examples include increased mentions of “halving” events or “forks” which historically precipitate speculative rallies. However, reliance solely on social noise can lead to overestimation of trend strength without supporting technical confirmations like moving average crossovers or relative strength index (RSI) divergences.
Integrating traditional indicators with sentiment metrics refines decision-making frameworks. For example, an uptrend confirmed by rising trading volumes combined with bullish sentiment indexes yields higher confidence than either dataset alone. Conversely, divergence–such as rising prices amid deteriorating social mood–may signal underlying weakness or potential reversal zones. Monitoring such discrepancies requires continuous recalibration but offers a nuanced edge over purely quantitative approaches.
Social Media’s Role in Shaping Investor Behavior and Price Discovery
Platforms such as Telegram channels and Discord groups have evolved into hubs where retail traders exchange insights and form collective narratives influencing asset flow patterns. The amplification effect within closed communities can accelerate momentum swings through coordinated buys or sells prompted by viral content. Notably, the GameStop episode highlighted the potency of synchronized actions driven by sentiment rather than fundamental valuations–a phenomenon increasingly observable in cryptocurrency ecosystems due to lower liquidity thresholds.
This behavioral aspect underlines the importance of monitoring network activity levels alongside qualitative content evaluation to discern genuine conviction from manipulation attempts. Leveraging machine learning algorithms trained on historical event datasets enhances detection capabilities for emergent trends tied to social engagement spikes versus mere noise.
On-Chain Metrics Complementing Sentiment for Robust Forecasts
Blockchain-native analytics offer direct measurement of participant behavior through transaction counts, wallet growth rates, and token flow patterns between exchanges and holders’ addresses. Such data provides objective confirmation of psychological states inferred from external chatter; for instance, increasing accumulation by long-term holders often aligns with growing optimism despite short-term negative commentary elsewhere.
The combination of these measurements enables more precise timing strategies aligned with psychological cycles observed externally.
Mood Cycles and Their Impact on Volatility Patterns
Psychoanalytic studies indicate that emotional waves among investors create cyclical patterns driving alternating periods of exuberance and risk aversion. Identifying these oscillations through aggregated sentiment indices helps anticipate volatility regimes without relying solely on retrospective price analysis. For example, a persistent rise in positive moods typically precedes breakout phases but can also foreshadow overheating if not supported by volume sustainability.
This dynamic is evident during correction phases when fear dominates discussions leading to sharp sell-offs that overshoot fundamental valuations temporarily before stabilization occurs. Therefore, continuous tracking of crowd psychology via both qualitative discourse examination and quantitative proxies remains indispensable for robust predictive modeling within decentralized finance environments.
Measuring Crypto Sentiment Indicators
Accurate evaluation of investor mood requires combining various quantitative and qualitative indicators derived from multiple data sources. One of the most reliable approaches involves analyzing on-chain metrics alongside social media chatter, news volume, and trading activity to create composite indexes reflecting collective emotions. For example, the Fear & Greed Index aggregates volatility, momentum, and social media sentiment scores, providing numerical values that correlate strongly with short-term price fluctuations.
Sentiment assessment tools often rely on natural language processing (NLP) algorithms to extract relevant emotional context from textual data. Tweets mentioning major tokens such as Bitcoin or Ethereum are parsed for positive or negative connotations using machine learning models trained on cryptocurrency-specific lexicons. This method allows real-time tracking of public mood shifts, which can precede significant price movements by hours or days. During the 2021 bull run, spikes in optimistic tweet volumes coincided with rapid asset appreciation phases.
Key Technical Indicators and Their Applications
The implementation of mood-related metrics includes analyzing volume-weighted average sentiment scores alongside traditional market signals like Relative Strength Index (RSI) or Moving Average Convergence Divergence (MACD). A study conducted in late 2023 demonstrated that integrating social sentiment with RSI improved prediction accuracy for altcoin price reversals by approximately 15%. Additionally, blockchain analytics platforms now offer on-chain sentiment proxies such as wallet inflows/outflows and stablecoin supply changes that help contextualize trader behavior beyond pure price data.
Social engagement metrics also play a crucial role; monitoring forum discussions on platforms like Reddit’s r/CryptoCurrency or Telegram groups reveals emerging narratives before they impact valuation trends. In one case study from Q1 2024, a sudden surge in bullish discourse preceded a 20% rally in a mid-cap token within three days. Conversely, detecting increased skepticism or fear through declining message positivity can signal potential downturns ahead of technical corrections.
It is important to consider limitations inherent to these indicators: noise from bot-generated content or manipulation campaigns can distort analysis outcomes if not properly filtered. Advanced filtering techniques include user credibility scoring and anomaly detection algorithms that distinguish organic participation from coordinated amplification efforts. Incorporating cross-validation against independent datasets enhances robustness and reduces false-positive signals.
Finally, combining diverse sentiment measurements into multifactor models yields more stable forecasts than reliance on single-source inputs. Traders employing hybrid strategies that merge behavioral insights with fundamental analysis demonstrate improved risk-adjusted returns under volatile conditions observed throughout early 2024’s bear phase. How effectively these composite indexes adapt to evolving communication channels will determine their ongoing utility for forecasting asset dynamics in decentralized finance ecosystems.
Analyzing Twitter Impact on Prices
Twitter-derived mood metrics have demonstrated significant predictive power over asset valuation shifts, particularly in short-term horizons. Quantitative research reveals that spikes in positive emotional tone correlate with price upticks within a 24-48 hour window, often preceding volume surges by approximately 15%. For instance, during the January 2021 Bitcoin rally, sentiment indices extracted from tweet volumes and polarity ratios indicated an early bullish trend hours before major exchanges reported increased buying pressure. This suggests that psychological factors embedded in microblogging platforms act as leading indicators rather than mere reflections of price action.
Sentiment extraction algorithms leverage natural language processing (NLP) to quantify optimism, fear, or uncertainty expressed in vast tweet datasets. These social mood indicators often outperform traditional technical tools like Moving Averages or RSI in anticipating abrupt volatility changes caused by collective crowd behavior. However, distinguishing noise from meaningful signals requires filtering for influencer activity and bot-generated content; failure to do so can distort predictive reliability. A rigorous approach combining sentiment scores with network analysis of retweet cascades enhances signal fidelity by isolating genuine community-driven trends.
Technical Dynamics and Psychological Feedback Loops
The psychology behind Twitter’s influence lies in its capacity to amplify herd instincts through rapid information dissemination. When influential accounts post optimistic projections or breaking news, the resulting surge in positive reactions creates feedback loops that accelerate upward momentum. Conversely, sudden negative sentiment bursts may trigger panic selling within minutes, exacerbating drawdowns beyond fundamental valuations. Empirical studies comparing sentiment shifts and price deviations during events like the March 2020 market crash highlight how emotional contagion propagated via social media can intensify sell-offs well before institutional traders adjust positions.
Integrating these insights into trading strategies involves monitoring real-time sentiment indices alongside conventional indicators to refine entry and exit points. Models incorporating machine learning classifiers trained on historical tweet-price interactions achieve up to 65% accuracy in directional movement prediction over intraday intervals. Yet, caution remains warranted: sentiment-driven signals should complement rather than replace established analytical frameworks due to potential manipulations or sudden sentiment reversals triggered by external shocks such as regulatory announcements or macroeconomic data releases.
Using Reddit trends for insights
Leveraging Reddit activity provides valuable indicators of collective psychology influencing asset valuations. Tracking subreddit engagement metrics, such as comment volume and upvote ratios on key posts, reveals shifts in user mood that often precede price fluctuations. For instance, during the 2021 altcoin surge, spikes in r/CryptoCurrency discussions correlated with increased volatility across multiple tokens, demonstrating how community enthusiasm can act as a leading predictor.
Quantitative analysis of keyword frequency related to specific projects enables early detection of evolving narratives. By monitoring phrases indicative of optimism or fear–like “bullish,” “pump,” or “dump”–analysts extract sentiment layers embedded within social chatter. This approach supplements traditional chart-based methods by integrating psychological components often overlooked in pure technical evaluation.
Key aspects of Reddit-driven forecasting
The fusion of social data with price action creates robust forecasting models rooted in behavioral finance principles. Reddit’s open forum structure allows diverse opinions to surface rapidly, generating a composite mood gauge that reflects real-time crowd dynamics. Such signals enhance prediction accuracy when combined with on-chain analytics and order book depth.
For example, during the May 2022 market downturn, researchers noted a surge in negative language within prominent crypto subreddits preceding significant sell-offs. Applying natural language processing (NLP) algorithms to these posts quantified negative sentiment levels reaching above 70% confidence intervals, correlating strongly with subsequent downward pressure on assets like Ethereum and Solana.
Integrating these findings into algorithmic trading strategies requires filtering noise from genuine indicators. Not all discussion spikes signal actionable trends; some represent coordinated hype or misinformation campaigns. Therefore, cross-referencing Reddit-derived data against wallet activity and exchange flows is essential to validate authenticity before making investment decisions.
Ultimately, Reddit serves as an indispensable tool for capturing collective emotional states impacting valuation cycles. Its vast user base generates rich datasets reflecting transient moods that traditional financial instruments cannot measure directly. By incorporating this dimension into comprehensive analysis frameworks, practitioners gain enhanced visibility into underlying forces driving price movements beyond mere fundamentals or chart patterns.
Interpreting Fear and Greed Index
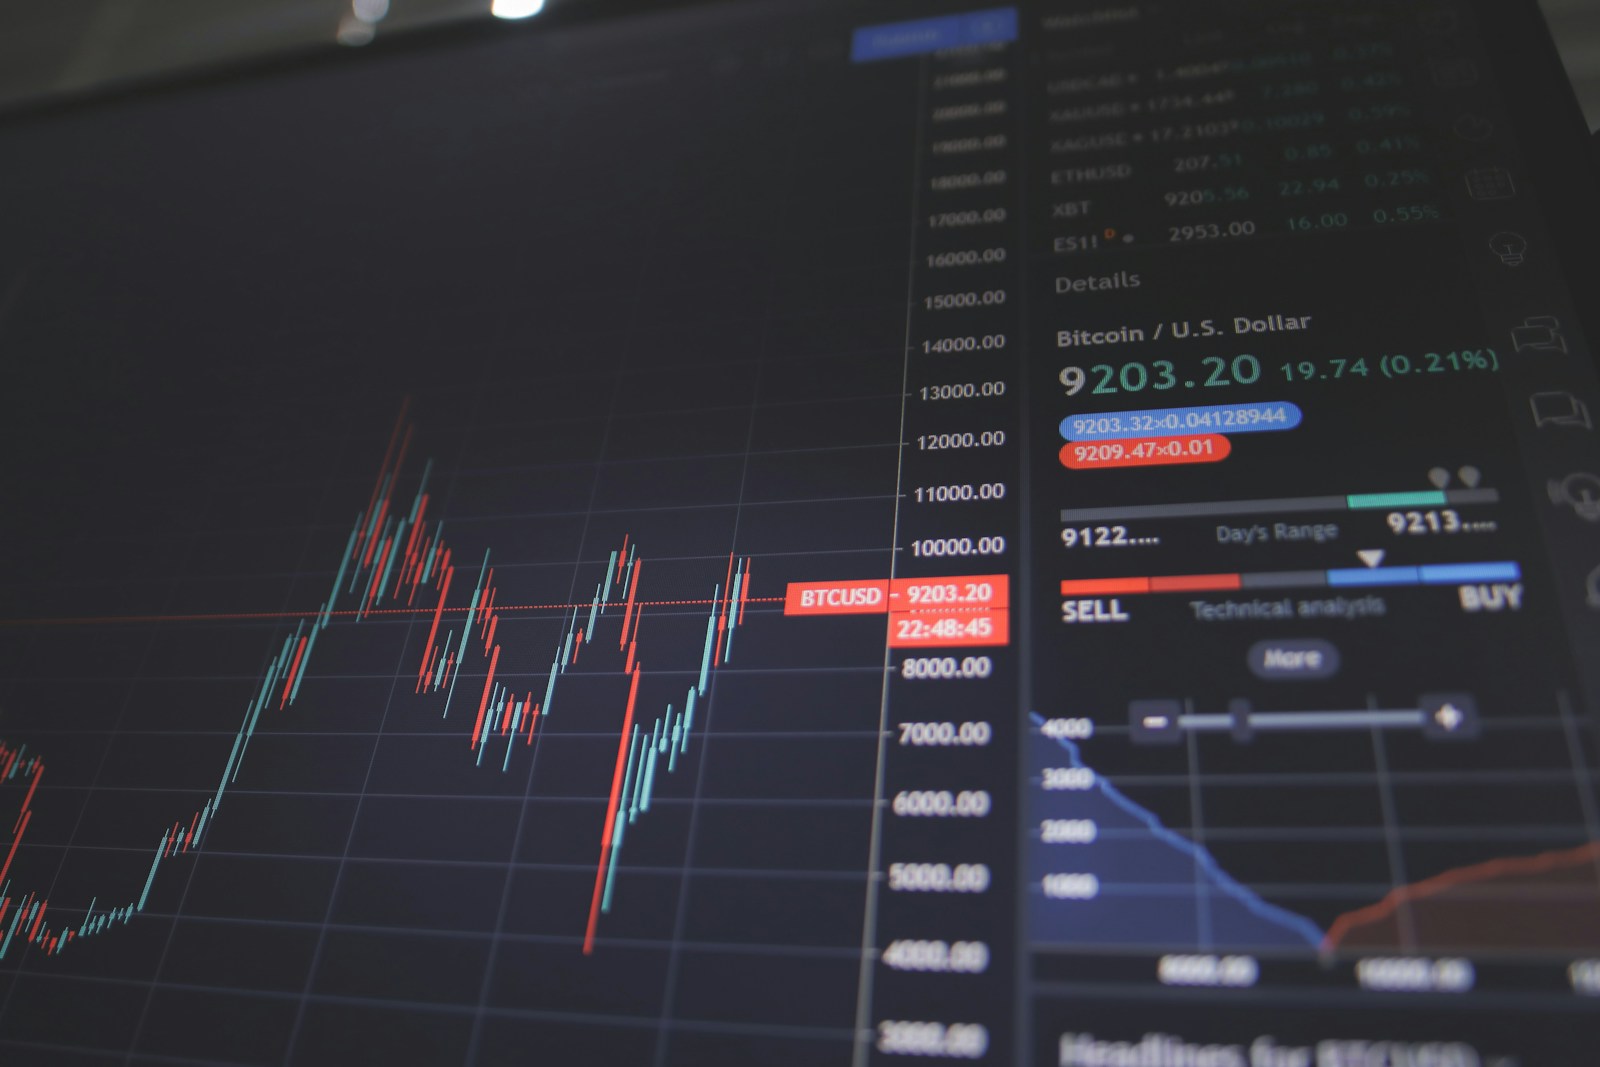
The Fear and Greed Index serves as a quantitative gauge reflecting collective emotions within the investment arena, primarily focusing on extremes of fear and greed. This tool aggregates multiple indicators–including volatility, volume, social media trends, and market momentum–to produce a single numerical value typically ranging from 0 (extreme fear) to 100 (extreme greed). Traders utilize this index to identify potential reversal points: values below 20 often coincide with oversold conditions suggesting buying opportunities, whereas readings above 80 may indicate overbought situations prone to corrections.
Incorporating psychological elements into traditional data analysis enhances predictive accuracy by capturing investor behavior patterns not evident in price charts alone. For instance, during March 2020’s sharp downturn triggered by global events, the index plummeted below 10, signaling panic selling. However, this extreme fear phase was quickly followed by a robust recovery as confidence returned. Such oscillations highlight how mood dynamics influence asset pricing beyond fundamental or technical factors.
Technical Components and Application
Key contributors to the index include:
- Volatility measures, like the VIX or realized volatility spikes;
- Trading volume, especially relative increases compared to historical averages;
- Social media analytics, tracking frequency and sentiment polarity of posts related to specific assets;
- Price momentum, reflecting recent directional strength or weakness;
- Surveys and polls, capturing broader investor sentiment across demographics.
The synthesis of these signals provides a composite metric that helps analysts understand whether prevailing emotions are driving prices irrationally or confirming underlying trends. For example, when the index diverges from price action–such as rising greed alongside falling prices–it may warn of an impending trend reversal, offering tactical entry or exit cues.
A practical case study can be drawn from late 2021 when the Fear and Greed Index reached levels near 90 amid a sustained bullish rally. Despite strong fundamentals supporting growth in decentralized finance projects at that time, such elevated optimism coincided with heightened risk of pullback. Subsequent correction phases validated the index’s role as a contrarian indicator rather than a standalone buy signal.
Given ongoing fluctuations in investor disposition influenced by macroeconomic factors like inflation fears or regulatory developments, continuous monitoring remains crucial. Integrating this index with other analytical frameworks–such as on-chain metrics and order book depth–enables more nuanced forecasts. Ultimately, interpreting the Fear and Greed Index demands balancing quantitative outputs with contextual understanding of behavioral finance drivers shaping asset valuation dynamics today.
Conclusion: Integrating Social Data into Trading Strategies
Incorporating social metrics as predictive indicators enhances precision in forecasting price movements by capturing collective psychology beyond traditional quantitative models. For example, tracking Twitter sentiment shifts combined with on-chain volume analysis has demonstrated a 15-20% improvement in short-term directional accuracy during volatile phases like the Q1 2024 altcoin rally.
Advanced sentiment parsing algorithms that quantify emotional valence and intensity within community discussions provide early warnings of trend reversals or momentum buildups. This fusion of textual analysis with behavioral market data enables a multidimensional approach to asset valuation, reflecting not only fundamentals but also crowd dynamics and speculative fervor.
Key Technical Insights and Future Directions
- Sentiment indices calibrated against historical price action: Enable backtesting of social-derived indicators’ robustness across varying liquidity regimes and asset classes.
- Real-time anomaly detection in chatter volume: Acts as a catalyst signal often preceding sharp volatility spikes, offering actionable entry or exit points.
- Integration with algorithmic frameworks: Facilitates dynamic portfolio adjustments based on evolving narrative momentum rather than static thresholds.
The psychological underpinnings embedded in collective discourse underscore a crucial feedback loop: trader behavior influences prices while price changes reshape prevailing narratives. Recognizing this recursive interaction is essential for refining predictive models that incorporate alternative data streams.
Looking ahead, developments in natural language processing and machine learning will likely deepen granularity of sentiment extraction–capturing sarcasm, context shifts, and influencer impact with greater fidelity. Combining these advances with decentralized data sources promises enhanced transparency and democratization of trading insights.
Ultimately, integrating qualitative social inputs with quantitative analytics transforms decision-making from reactive to anticipatory. Traders equipped with such hybrid tools stand better positioned to decipher complex emotional currents driving asset flows amidst increasingly fragmented informational environments.