 Mark
Mark- October 15, 2025
- 11 minutes Read
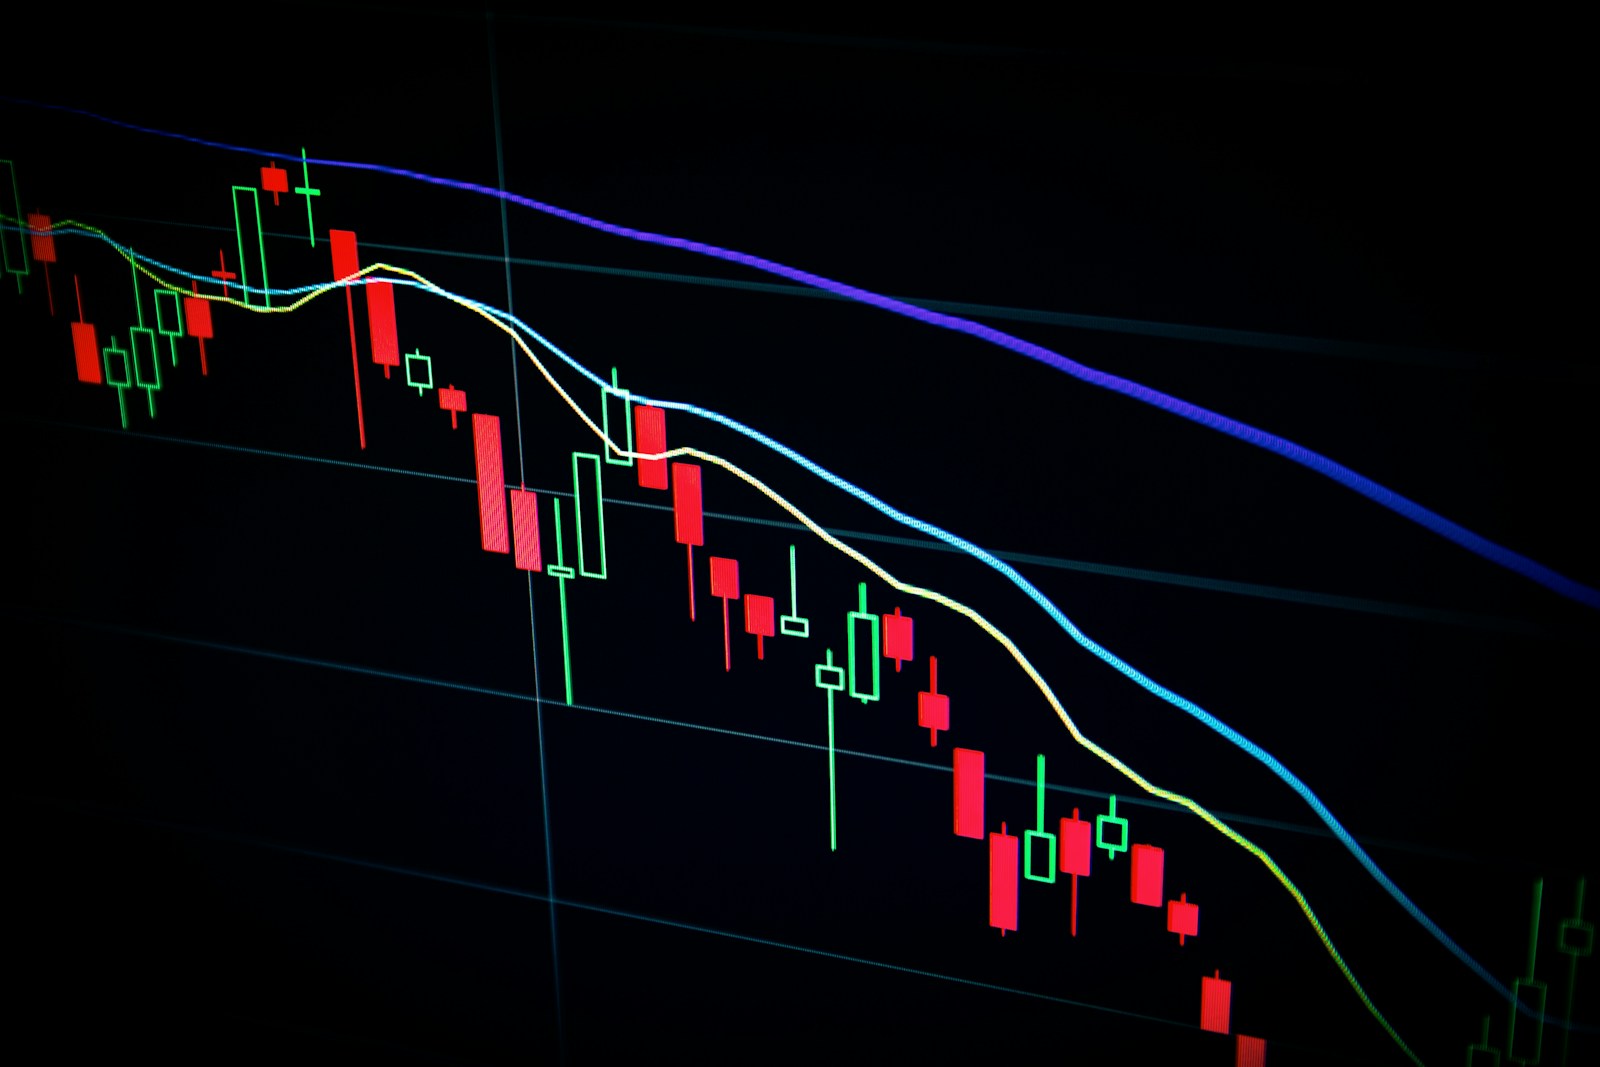
Bollinger bands – volatility analysis for crypto traders
Utilizing the standard deviation of price movements is one of the most reliable methods to quantify market fluctuations. This technical indicator calculates upper and lower thresholds based on a moving…